Create an Infographic in Your Browser
Create infographics for free with editable charts, figures and diagrams. Customize a 1080 × 1350 design, then export PNG or PDF.
Real editable templates
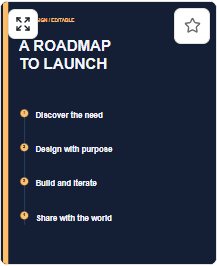 Launch Roadmap
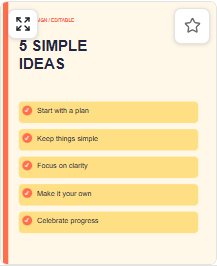 Five Smart Tips
Turn a checklist, timeline or set of metrics into a legible visual summary.
How to make it
- Pick an infographic template or open a blank 1080 × 1350 design.
- Replace the sample figures and labels with your own verified information; adjust text and chart elements.
- Review the chart meaning and visual hierarchy, then export PNG or PDF.
What you can create
- Step-by-step guides, checklists and educational summaries.
- KPI snapshots, simple statistics and project timelines.
Common questions
Can I edit numbers in the infographic?
Yes. Template labels, numbers, shapes and supported chart elements are editable. Review them for accuracy before exporting.
Can I export an infographic as a vector?
The editor supports SVG export for supported vector content, but imported raster photos will not become vectors. PNG and PDF are also available.